
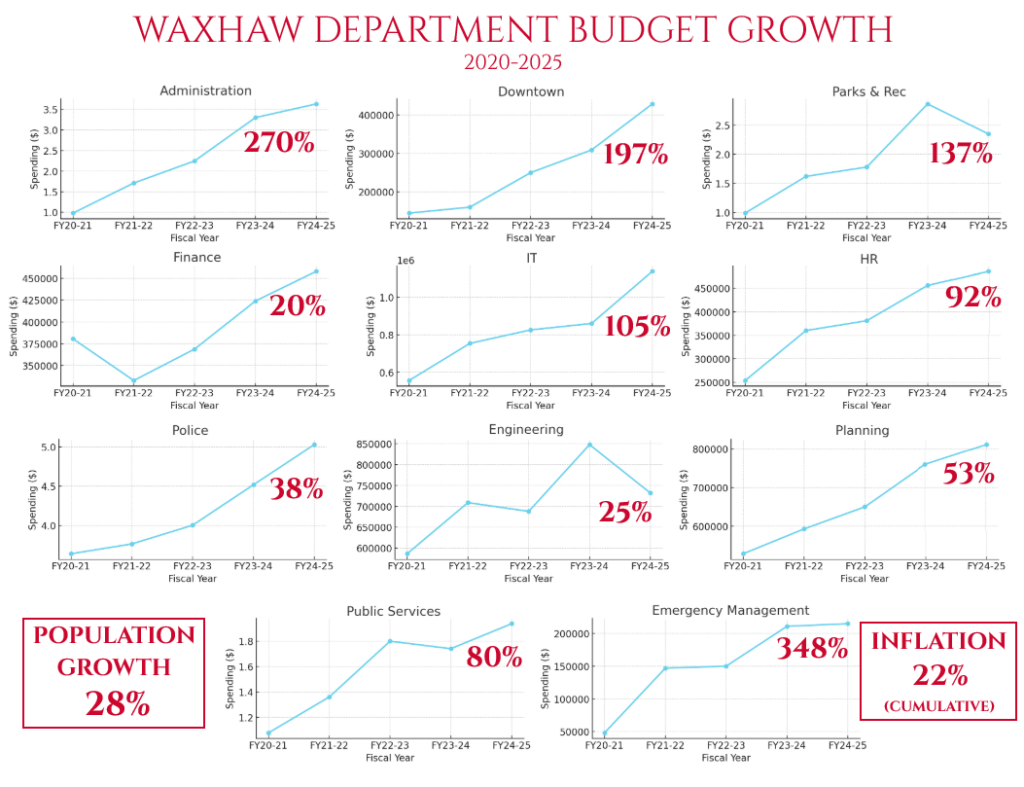
Over the past five fiscal years, Waxhaw’s government spending trends have increased significantly across multiple departments. While population growth and inflation have contributed to rising costs, spending in several areas has outpaced both metrics. As we progress through budget season, it’s helpful to visualize departmental budget growth from FY20-21 through FY24-25.
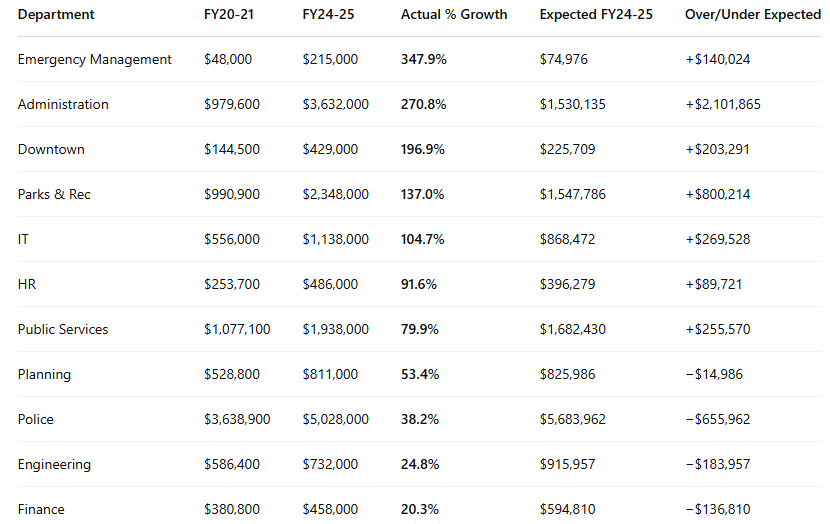
These increases might seem generally high, but if we consider population growth and inflation, how much might we expect them to reasonably grow? If we multiply population growth by inflation we can calculate a number for expected budget growth.
Expected Budget Growth = Population Growth x Inflation
1.28 × 1.22 = 1.5616
Based on this, we can say the budgets should have reasonably grown by about 56.2% over that period.
This assumes departments are maintaining the same per capita services, adjusted for higher costs of goods and wages. Any increase beyond 56.2% may suggest service expansion, inefficiencies, or mission creep—while below that could indicate improved efficiency or service cuts.
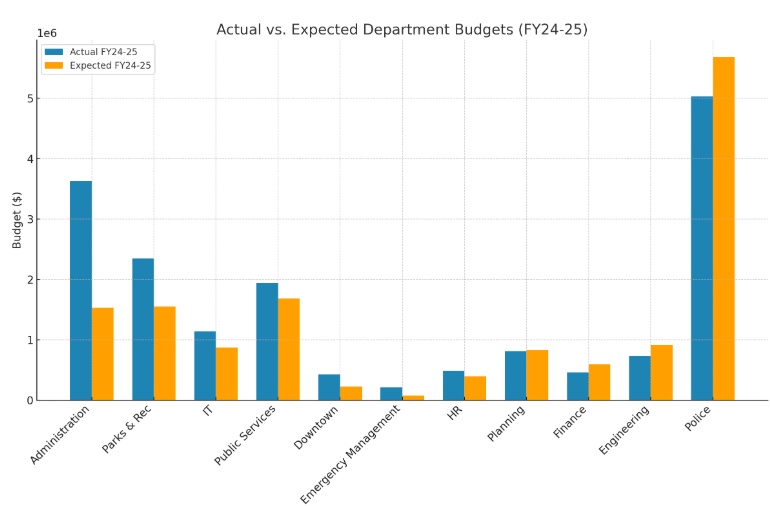
Here’s a chart comparing each department’s actual FY24-25 budget to the expected budget if it had only grown in line with population (28%) and inflation (22%). Departments with much higher bars in blue than orange have grown more than what might be considered reasonable.
Over the past five years, the budgets of some town departments have expanded well beyond what could be justified by population growth or inflation. While a growing town naturally requires more resources, the data makes clear that spending has sometimes outpaced reasonable expectations. Without serious attention to fiscal discipline, these trends risk placing an unsustainable burden on current and future taxpayers. Responsible governance demands that we align our spending with actual need—not unchecked expansion.
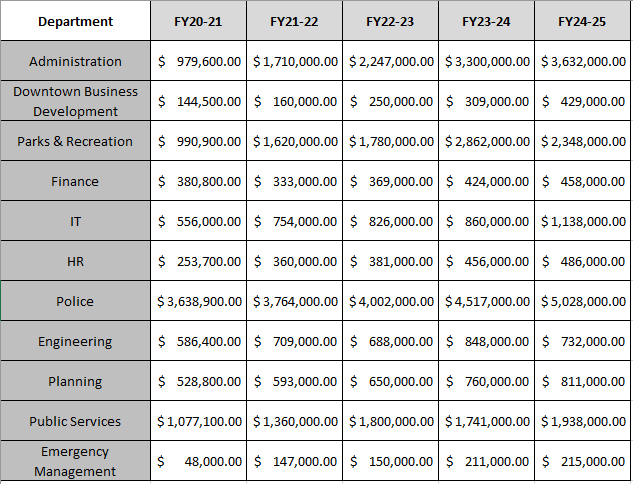
Data for reference: